Node Examples for Unstructured Grids
Here are listed various node setups used for processing unstructured grid (vtkUnstructuredGrid) data composed of 3D cells. Examples below utilize the cubeflow OpenFOAM dataset located in examples_data folder of the add-on sources. This is a very small and simple 5x5x5 hexahedral mesh with 5 time points for testing and debugging purposes.
The node tree examples below are available in Tree tab, Examples, names starting with cubeflow. After importing an example, change the frame number to 5 in Blender Timeline Editor, if you want to get same results as in examples below. Then run Update Node on the final nodes to update the pipelines.
For more elaborate visualizations, please have a look at a gallery thread on blenderartists.
Set Up Reader
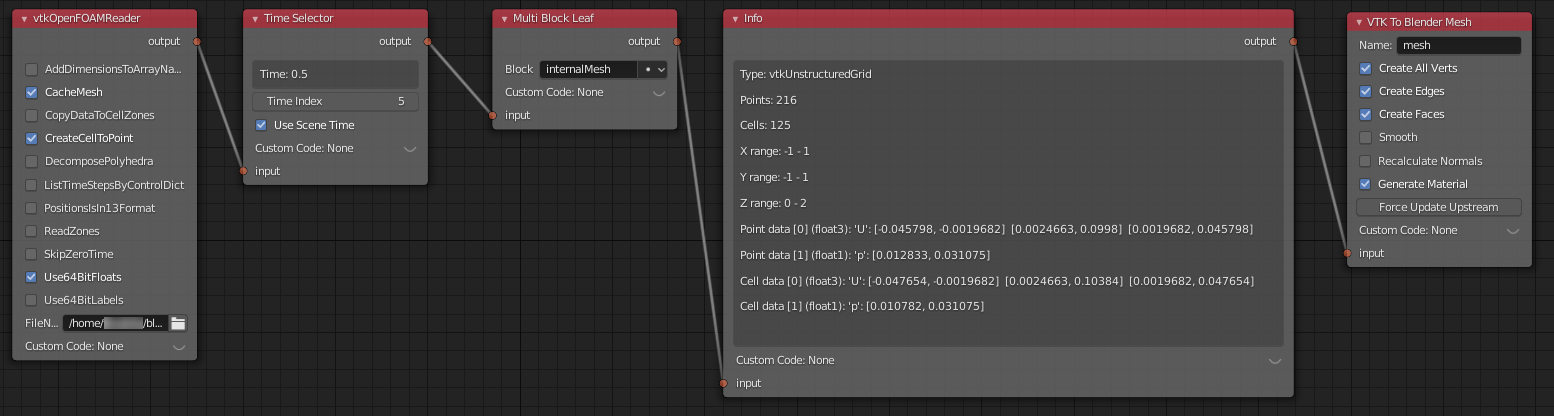
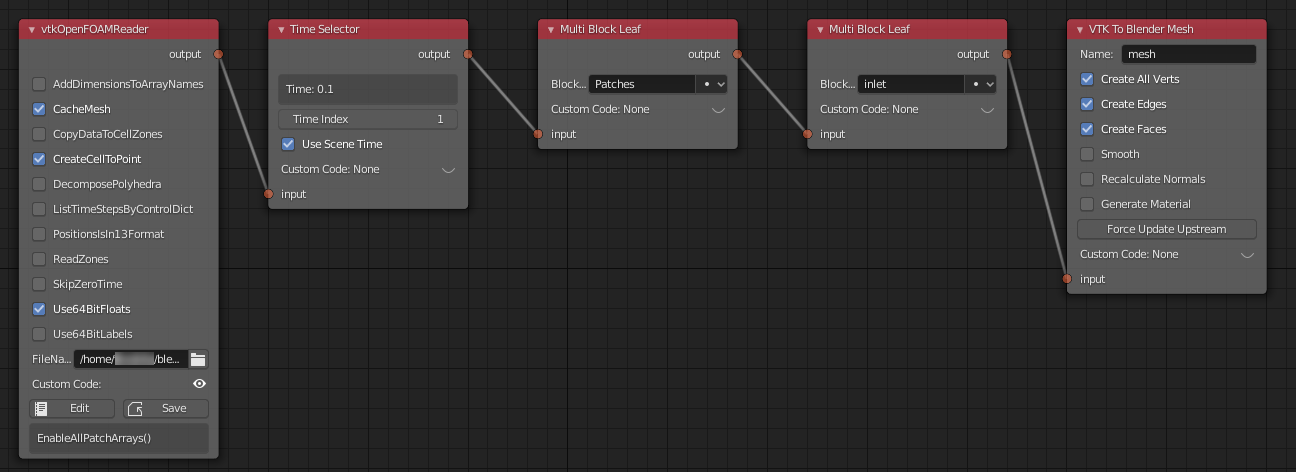
This node tree example name is cubeflow_base_boundary. This is a typical start node setup which contains a reader node vtkOpenFOAMReader to read data, a Time Selector node to specify time, a Multi Block Leaf node to select the correct data block, an Info node to show the pipeline contents, and finally a VTK To Blender Mesh node to create the boundary mesh as a Blender mesh object.
Press Update Node button on Info node to update pipeline. If data is read in correctly, the Info node shows number of points/cells, and fields read in.
You need to select correct reader node depending on your data type. Note
that you may need to adjust reader settings and/or add Custom Code
(see Addition of Custom Code to VTK Nodes)
to some readers, depending on your case and data. For example, to force
the parallel OpenFOAM reader vtkPOpenFOAMReader to read the decomposed
case files instead of reconstructed serial case files, you must add
custom code SetCaseType(0) to the reader node.
- vtkXMLUnstructuredGridReader for .vtu files
- vtkPolyDataReader for some .vtk files
The following node setups assume that the input of the first node is connected to some data source which produces vtkUnstructuredGrid with data for 3D cells, such as the output of Multi Block Leaf node in example above.
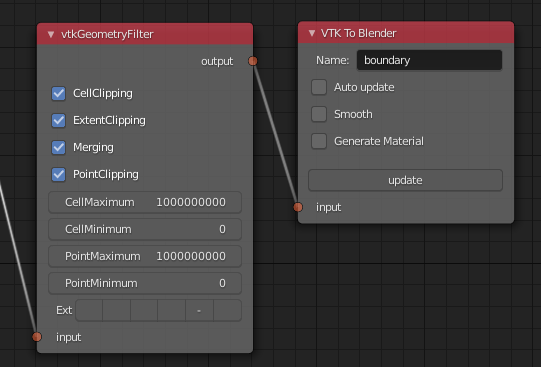
Extract Boundary Surfaces
VTK To Blender Mesh node extracts all boundary surfaces.
For forks other than tkeskita/bvtknodes you can use vtkGeometryFilter followed by the legacy VTK To Blender node. Note: This may not produce correct results for polyhedron meshes.
If you want to extract a single boundary patch for OpenFOAM case, you need to
- Add
EnableAllPatchArrays()Custom Code to vtkOpenFOAMReader (see Addition of Custom Code to VTK Nodes). - Add two Multi Block Leaf nodes in series to select patches and the wanted patch, before connecting to VTK To Blender Mesh.
- Run Update Node and Force Update Upstream on VTK To Blender
Mesh node to make the
EnableAllPatchArrays()work correctly.
This node tree example name is cubeflow_boundary_patch.
Field Data Calculations
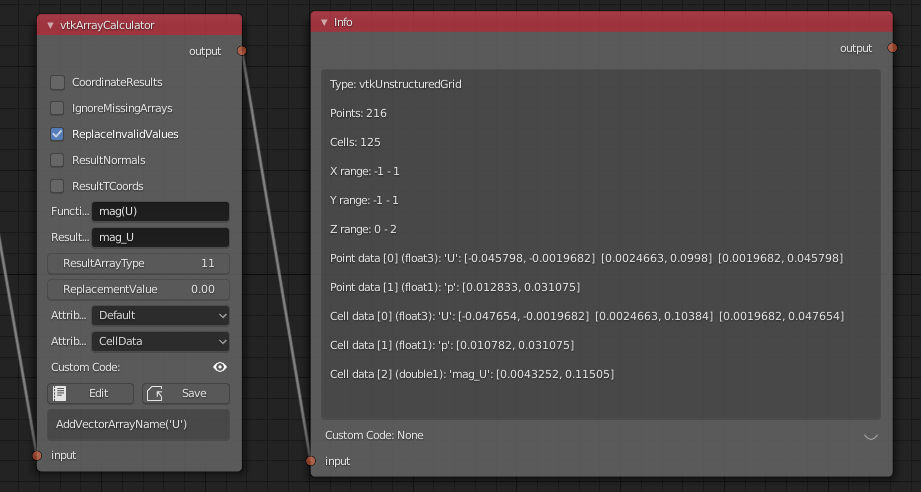
You can use vtkArrayCalculator to calculate new fields from existing fields.
In vtkArrayCalculator node, write the calculator code to Function field, the result array name to ResultArrayName, and select correct type for the AttributeType field. Disable Coordinate Results. Finally you must specify the array names which are operated on by Custom Code like:
AddVectorArrayName("U")
See the list of operators in vtkArrayCalculator docs. Some examples for Function field:
- First U vector component can be extracted by expression like
U.iHat - U vector magnitude can be calculated with
mag(U)
- First U vector component can be extracted by expression like
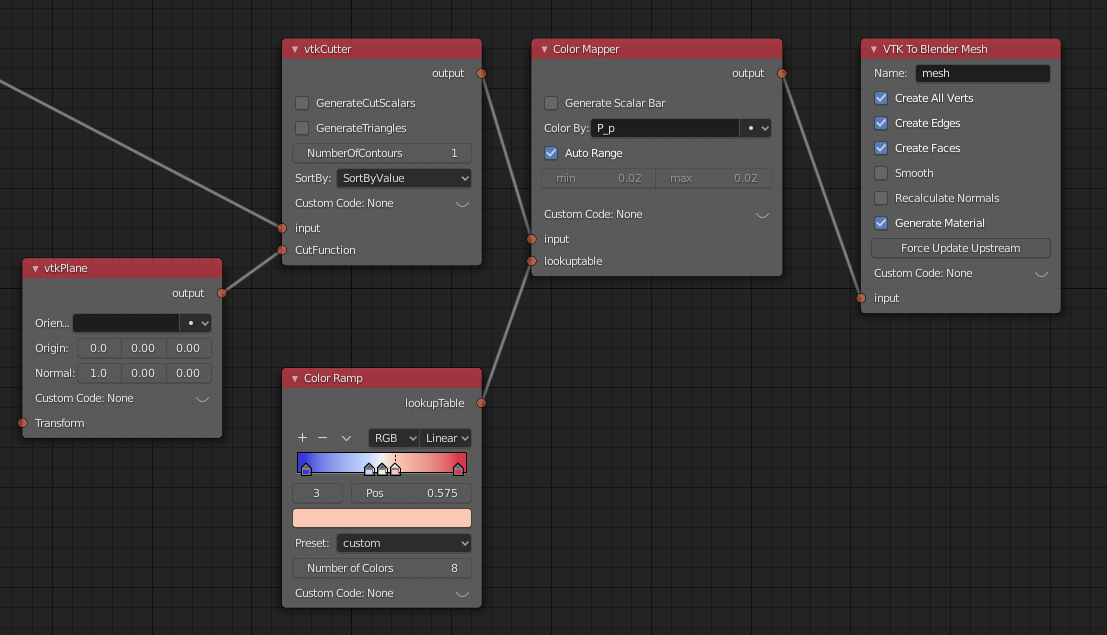
Cutting Field Data
Use vtkCutter in combination with a geometry generator (like vtkPlane) to slice your field data. Combine with Color Mapper and Color Ramp to color by field value. The name of this example node tree is cubeflow_cut_plane.
- Connect vtkPlane to the CutFunction connector on the vtkCutter node.
- Disable GenerateCutScalars and GenerateTriangles in vtkCutter node.
- Connect Color Ramp to the lookuptable connector in the Color Mapper node.
- In the VTK To Blender Mesh node, you must enable Generate Material, so that result colors will be shown after final Update. Note: 3D Viewport must be in Material Preview or Rendered mode to see the colors.
- Run Update Node on the VTK To Blender Mesh node.
Here is the result in 3D Viewport shown in Material Preview Mode:
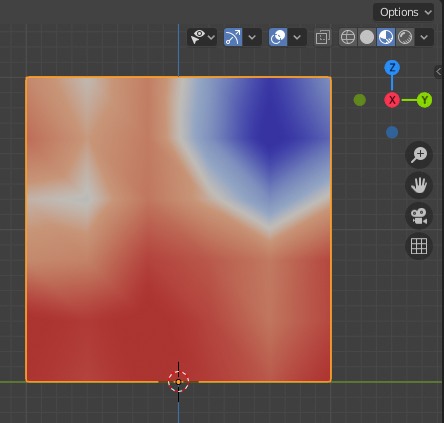
Note that the Color Ramp now features several color map presets, exported from matplotlib. The number of color values determine how closely the Color Ramp will match the underlying colormap (up to 32 samples are possible). Together with constant interpolation mode, this can create a contour-like effect on the surface.
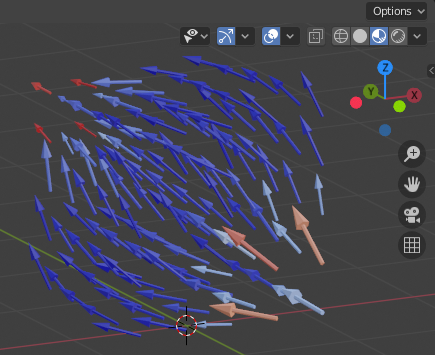
Vector Glyphs
Glyphs (like one produced by vtkArrowSource) can be placed at points, oriented and scaled by vtkGlyph3D node. This node tree example named cubeflow_vector_glyphs shows how to color glyphs by velocity magnitude.
- Add vtkCellCenters node to get points of cell centers.
- Add vtkMaskPoints node, and adjust MaximumNumberOfPoints to a small value and set OnRatio to 1 (no skipping of data points). It is good idea to use a small value for maximum number of points while tuning, so that calculation does not take a long time.
- Add vtkGlyph3D node, and set ScaleFactor to 0.5, ColorMode to ColorByVector, and ScaleMode to DataScalingOff.
- Connect vtkArrowSource to input 1, and add Color Mapper, Color Ramp, and VTK To Blender Mesh (with Generate Material enabled).
- Run Update Node on the final node.
Note
Selecting a vector field to Color By in the Color Mapper node will give wrong results. If vector magnitude is not generated by a VTK operator (like vtkGlyph3D does here), you can use vtkArrayCalculator upstream to generate it, see Field Data Calculations.
Note
If the glyphs are all incorrectly aligned along the positive X-axis
even when Orient is on, you need to add vtkAssignAttribute node
e.g. before vtkMaskPoints. You need to add Custom Code (see
Addition of Custom Code to VTK Nodes) to specify a data array to be activated, e.g.
Assign("U", vtk.vtkDataSetAttributes.VECTORS, vtk.vtkAssignAttribute.POINT_DATA)
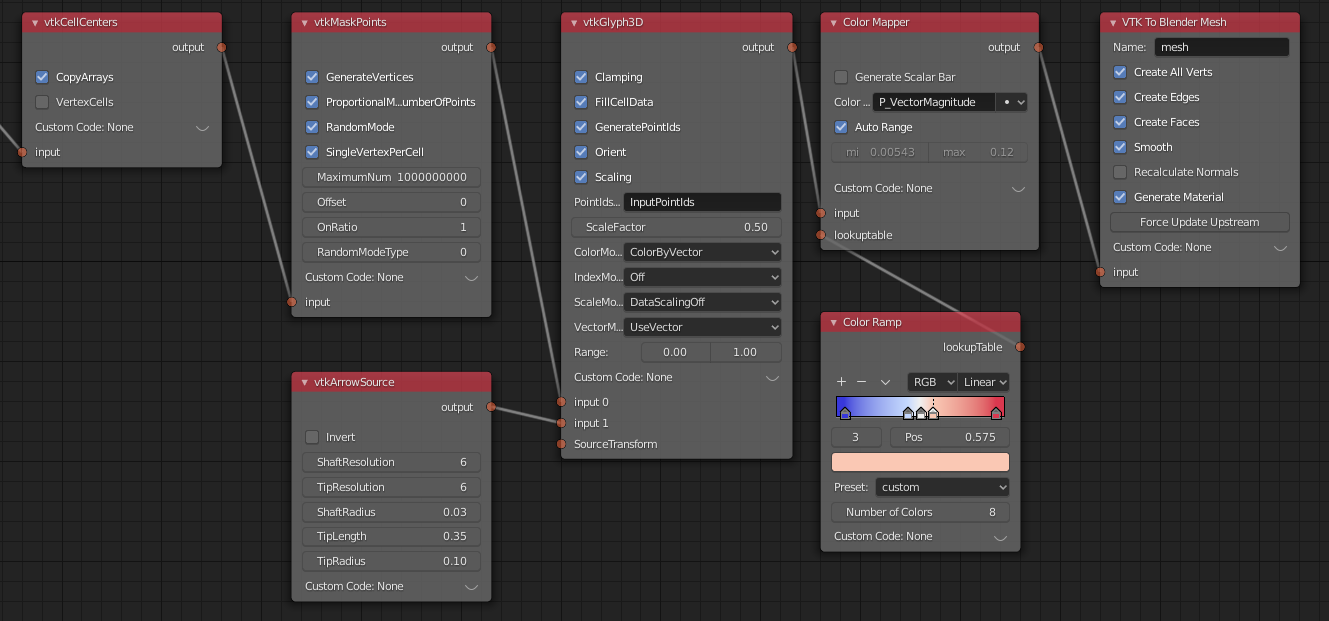
Here is the result in 3D Viewport shown in Material Preview Mode:
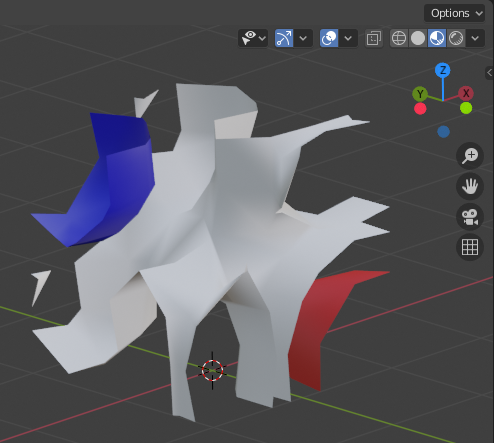
Contours
Contours can be generated with vtkContourFilter. This example node tree name is cubeflow_contours.
- First add vtkAssignAttribute node and add Custom Code (see Addition of Custom Code to VTK Nodes) to
specify a point data array to be used for contouring, e.g.
Assign("p", vtk.vtkDataSetAttributes.SCALARS, vtk.vtkAssignAttribute.POINT_DATA) - Add vtkContourFilter, and add wanted contour values: Single Value: 0.017, and Additional Values: 0.02, 0.023. Disable GenerateTriangles to retain polyhedrons (if wanted).
- Add Color Mapper, Color Ramp and VTK To Blender Mesh nodes. In VTK To Blender Mesh node, select both Generate Material and Smooth to get smoothened face normals.
- Run Update Node on the final node.
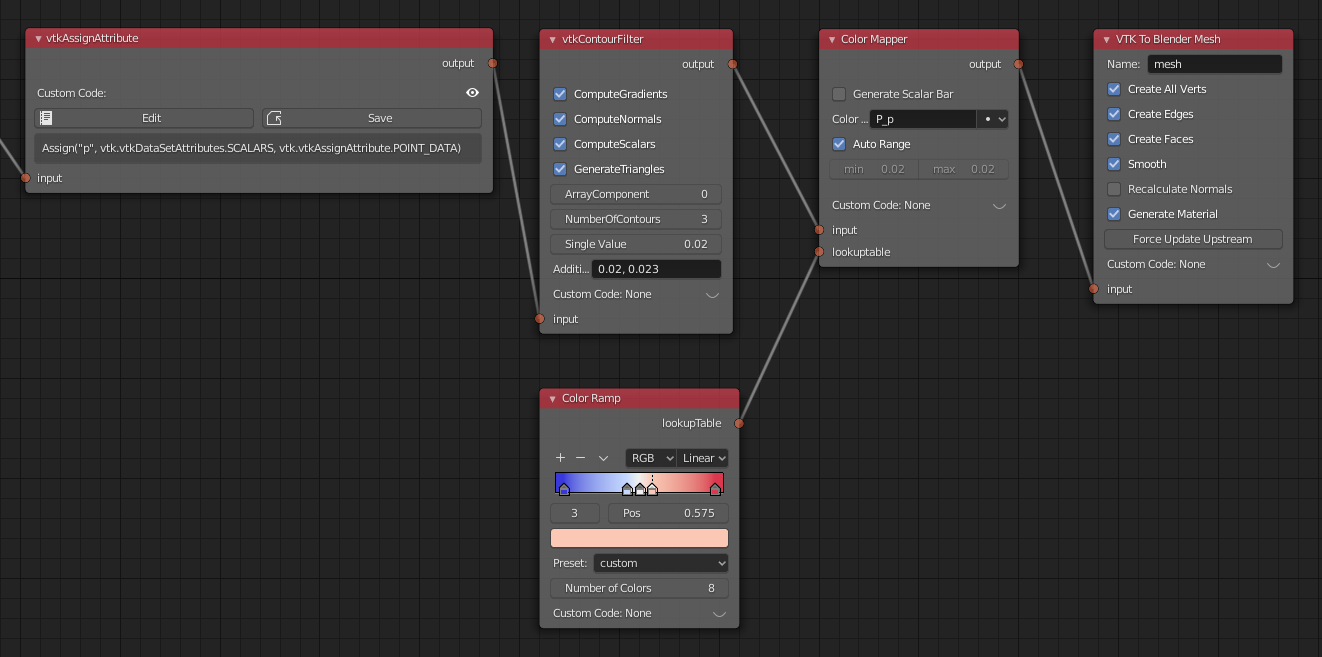
Here is the result in 3D Viewport shown in Material Preview Mode:
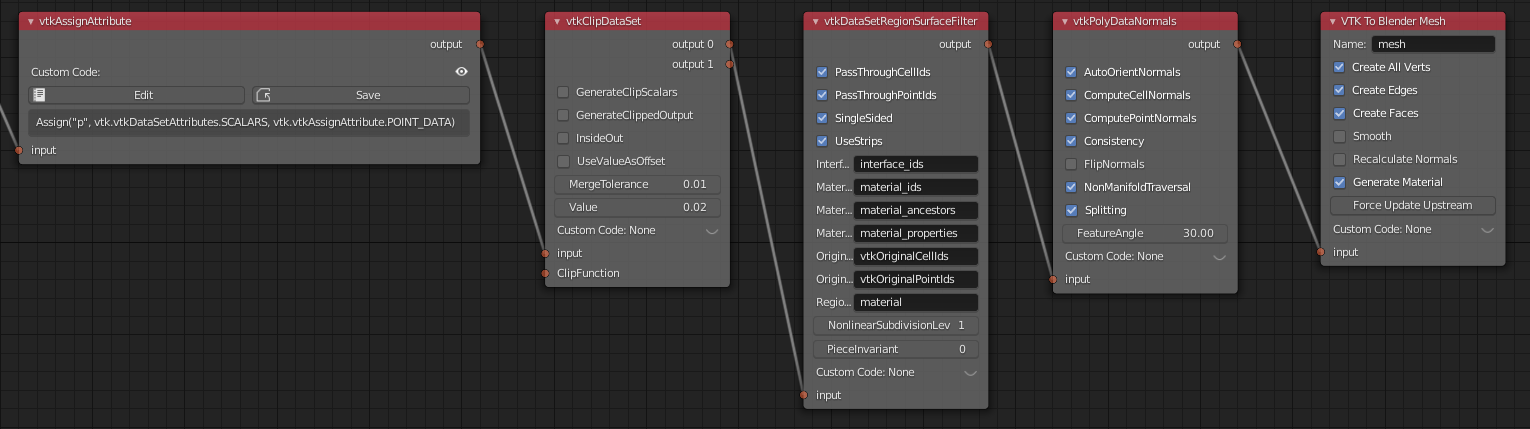
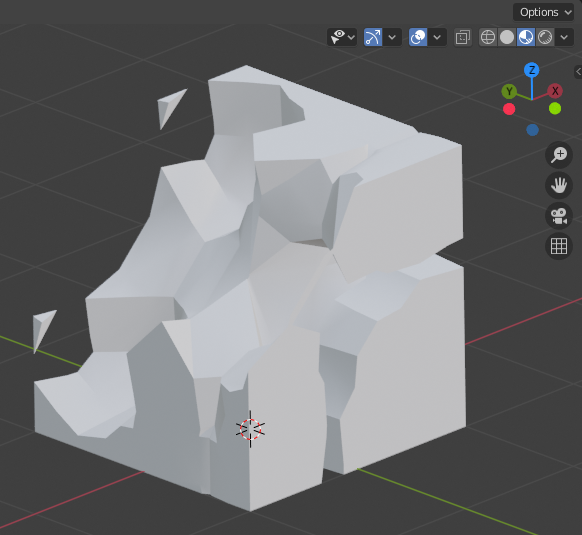
Iso-surface
A closed iso-surface (a contour with no holes in surface, e.g. for volumetric rendering) can be achieved by clipping with a value with this approach using vtkAssignAttribute, vtkClipDataSet, vtkDataSetRegionSurfaceFilter and vtkPolyDataNormals (to get consistent face normals). The name of this example tree is cubeflow_isosurface.
Here is the result in 3D Viewport shown in Material Preview Mode:
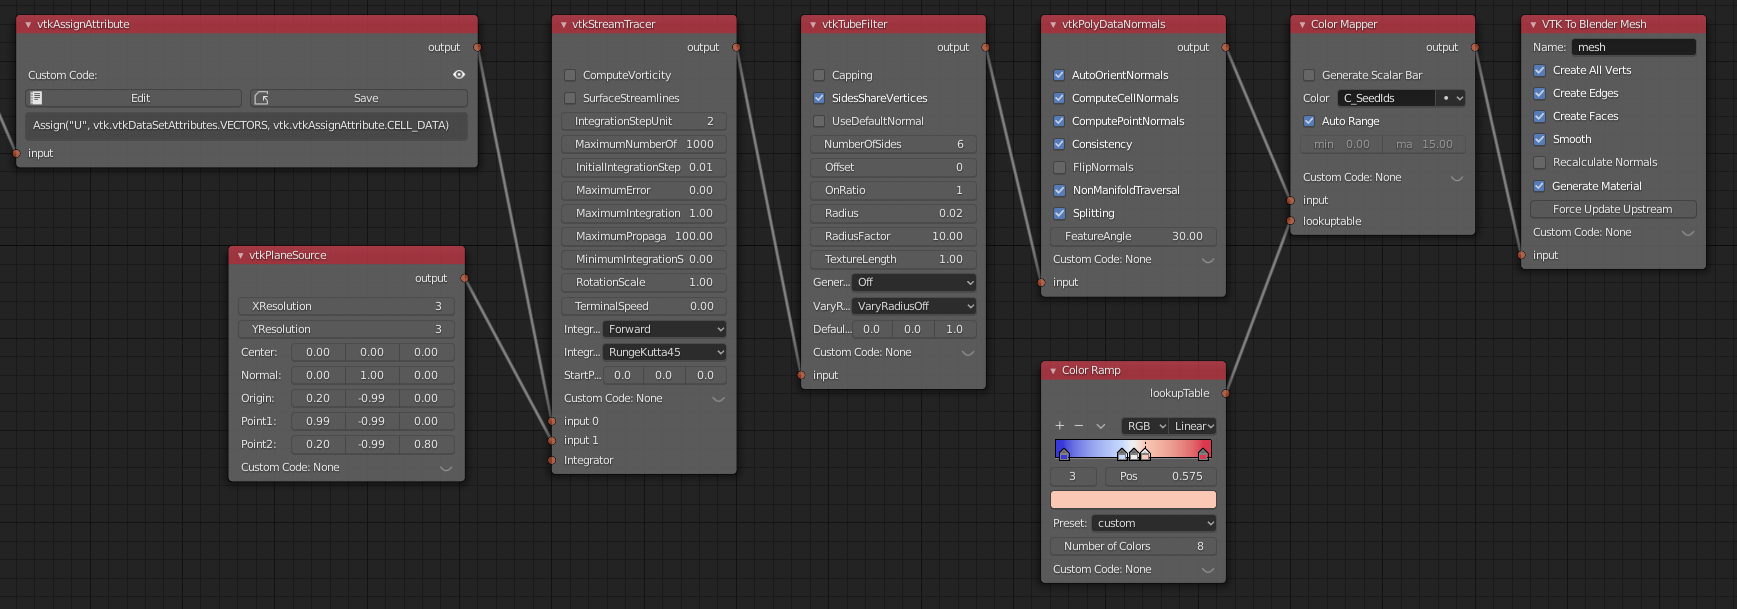
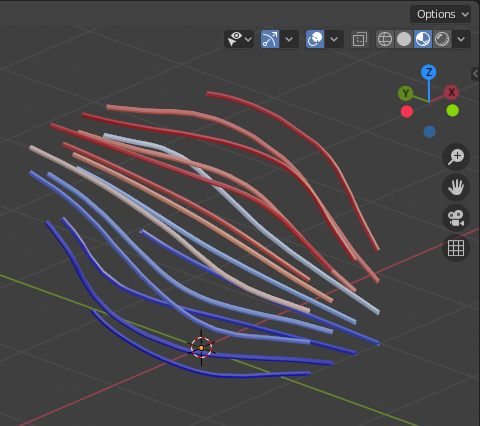
Stream Tracers
Stream tracers calculated by vtkStreamTracer can be visualized with e.g. vtkTubeFilter using this node tree example, named cubeflow_stream_tracers.
- Select the vector field for tracing with vtkAssignAttribute.
- Generate source points for stream tracer with e.g. vtkPlaneSource and make sure points are inside the domain.
- Add vtkStreamTracer and modify settings according to your case:
- MaximumNumberOfSteps should be a large value, but during testing phase you can use a small value to limit result mesh size.
- MaximumError should be a small value like 1e-9 for smooth traces.
- MaximumPropagation limits the length of path, should be a large value.
- MinimumIntegrationStepSize should be a very small value like 1e-10 to avoid early termination.
- Add vtkTubeFilter and adjust at least NumberOfSides and Radius.
- vtkPolyDataNormals (without FlipNormals) is needed to get good face normals for the result.
- Finally add Color Mapper, Color Ramp and VTK To Blender Mesh with Generate Material and Smooth on.
- Run Update Node on final node.
Here is the result in 3D Viewport shown in Material Preview Mode:
OpenVDB Export and Volumetric Rendering
Conversion of 3D vtkImageData into OpenVDB (.vdb format) and subsequent volumetric rendering of the OpenVDB files is possible by using the VTK To OpenVDB Exporter node. This example node tree name is cubeflow_openvdb_export. A VTKImageData Object Source node is used in conjunction with vtkProbeFilter to convert the unstructured grid data into vtkImageData (voxel data) required by the OpenVDB format.
Note: Make sure that sampling points in VTKImageData Object Source fall inside the domain at voxel center points.
Note 2: Location, rotation and scale are lost in the OpenVDB export.
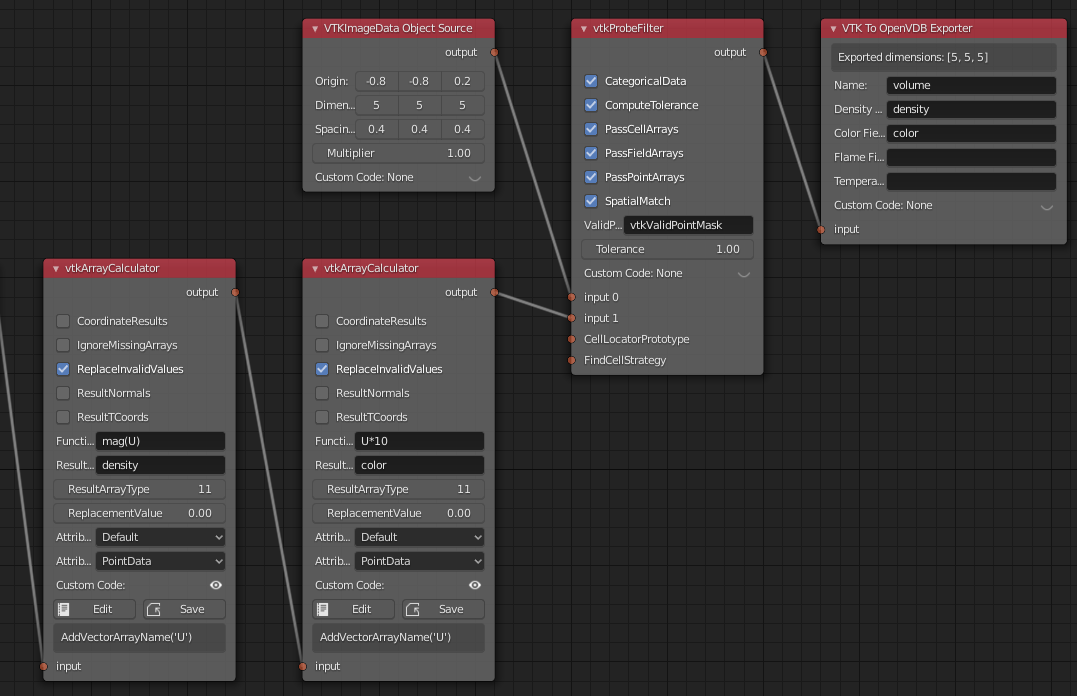
When the Update Node has been run for the VTK To OpenVDB Exporter node, an intermediate .json file is saved to the location of the Blender file, which can be converted to .vdb format according to instructions in the node documentation (see VTK To OpenVDB Exporter). After that, the OpenVDB file can be imported to Blender as a Volume Object.
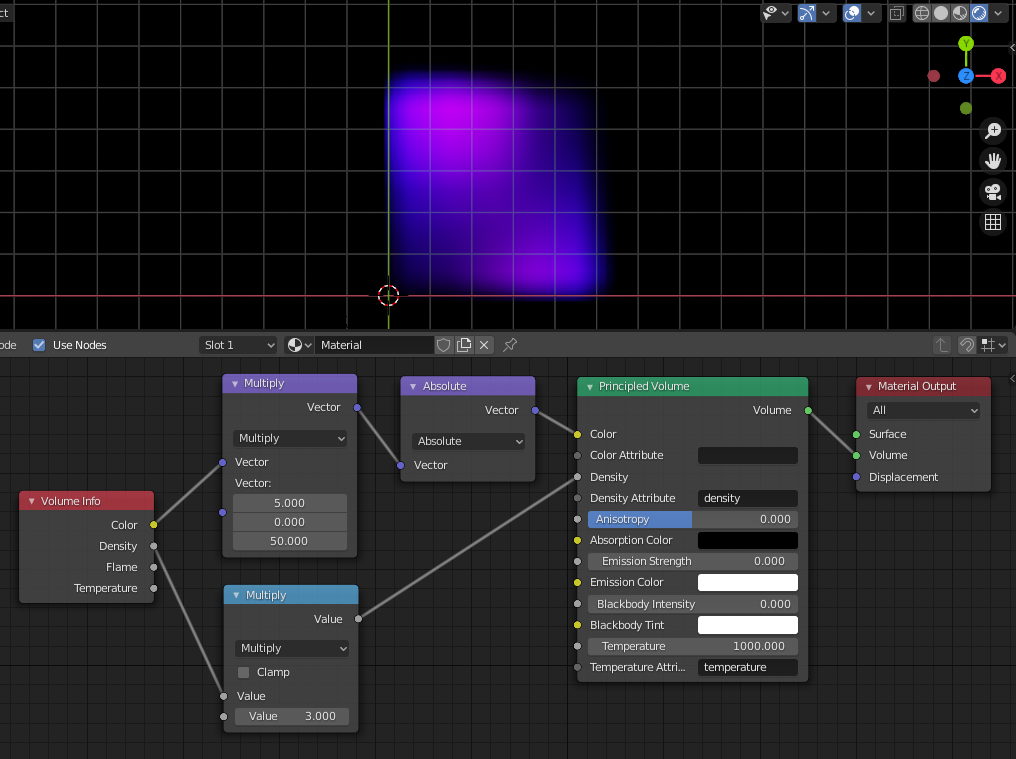
After importing OpenVDB file(s), you must add a volumetric material to the Volume Object in Blender Shader Editor. An example material node setup is shown below, with rendering of the result (volume_00005.vdb, viewed from above, using Eevee render engine), when lit only by a sun lamp with strength value 100. Color is manipulated in the material by two Vector Math nodes to add red color to velocity X component and blue color to velocity Z component.